Apr 5 2019
How can a dry topic like statistics become more interesting?
Students are often asked to calculate averages from a table or to find the median of some arbitrary set of numbers. Of course, this is important. But what if students can work with topics which they select themselves? Find a topic that interests them? And learn how to make graphs that show patterns in this data in an explicit way?
Our students learn how to make graphs by hand, in google sheets and in python.
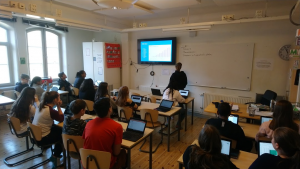
Below we see one of our students presenting her data. By making use of websites like for instance scb.se, students learn how to find patterns in real data and how to connect these patterns to events that take place in our world.
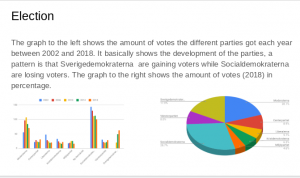
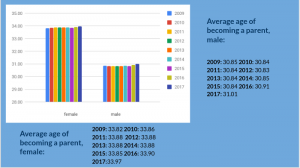
some results can be seen below.